
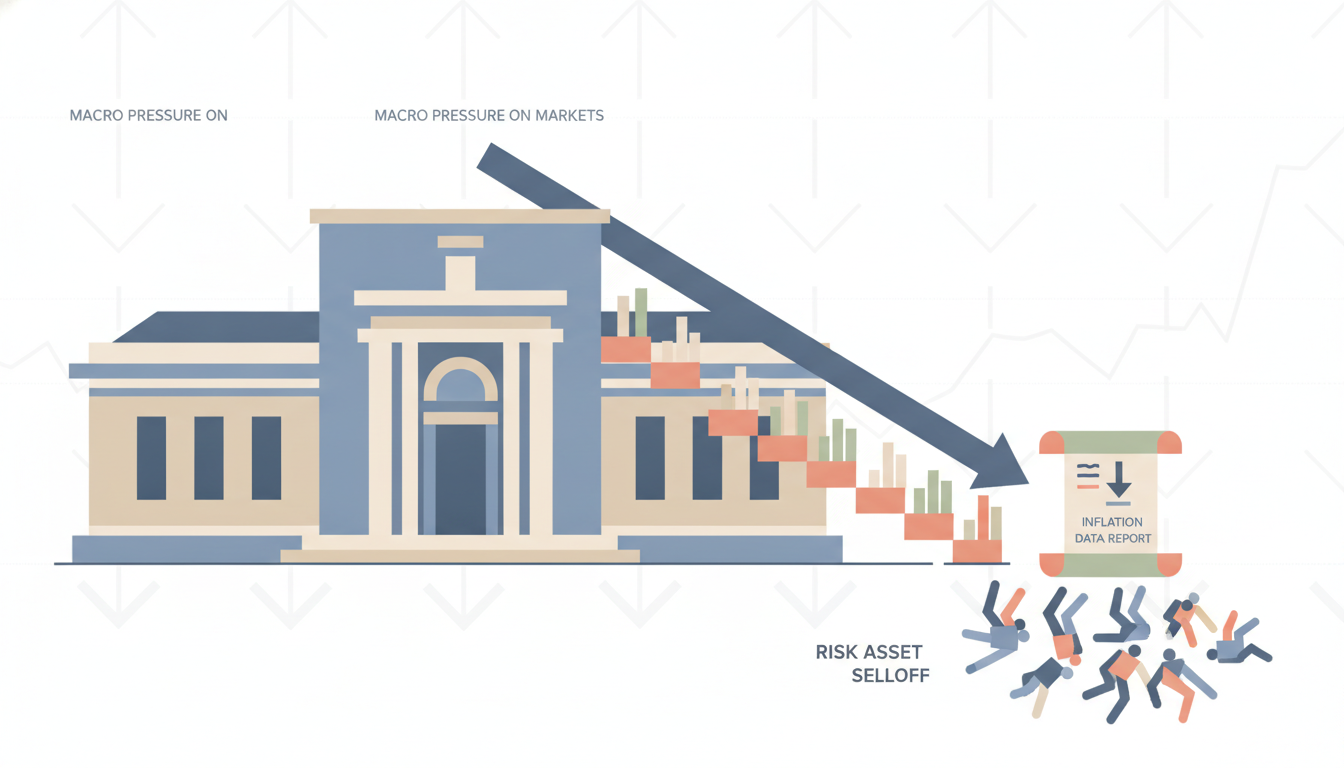
Bitcoin price decline after hot CPI data has become the story defining this week’s macro-crypto collision — and if you’ve been around long enough, you know exactly how this movie ends. October’s Consumer Price Index came in at +0.4% month-over-month, beating forecasts, with the core rate rising 0.3%. That’s not a rounding error. That’s the Fed getting handed a permission slip to tighten again, and markets read it instantly.
BTC is currently sitting at $73,512, down about 1.1% over the last 24 hours. That number doesn’t fully capture the psychological damage, though. We’re talking about a coin that was above $80K not long ago, now threatening to test support levels that analysts haven’t had to defend in months.
The CPI Print That Changed the December Calculus
The October inflation report wasn’t a disaster — but it was enough. As CoinDesk reported, the headline CPI rose a stronger-than-expected 0.4%, with the core rate up 0.3%. For context: the Fed has been looking for any reason to stay hawkish, and this handed them one on a silver platter. Markets didn’t wait for a press conference to draw conclusions.
Fed Governor Christopher Waller moved fast to confirm the read. According to Cointelegraph, rate-hike bets surged to 96% after Waller signaled he’d vote for a 25-basis-point increase at the December FOMC meeting. That’s not ambiguity — that’s a done deal barring a dramatic reversal in the data between now and then. The more alarming scenario, flagged by Cointelegraph’s inflation piece, is the growing whisper of a 50-basis-point hike. Hot inflation raising the odds of a half-point move in December is the kind of tail risk that keeps institutional desks cautious about adding BTC exposure right now.
Bitcoin Breaks From Stocks — and Not in a Good Way
Here’s the detail that should give Bitcoin bulls pause. When stocks wobbled on the CPI print and then rebounded intraday, BTC didn’t follow. CoinDesk noted that Bitcoin actually decoupled downward from equities — a break that’s rarely a good sign for crypto in the short term. When BTC ignores a stock rally, it usually means there’s something specific weighing on the asset itself, beyond the macro backdrop.
That something appears to be ETF outflows combined with institutional selling pressure. MARA — Marathon Digital, one of the largest publicly traded Bitcoin holders — reportedly reduced its holdings during this stretch, adding a bearish signal from a name that’s typically a buyer of last resort. Meanwhile, CoinDesk flagged earlier that BTC was already lagging the stock rebound even before the CPI data dropped — meaning the crypto market was pricing in trouble before it was confirmed. That’s not coincidence; that’s informed money moving quietly.
The ETF flow story is worth watching more closely than the price itself. When spot ETF products see sustained outflows during a macro shock, it often reflects institutional accounts reducing risk — not retail panic. Those are slower hands, and they don’t reverse overnight.
Where Support Actually Lives — and Why $70K Is in the Conversation
The Block’s analysis put the immediate support at $73,000, with analysts flagging a potential slide toward $69,000 if that level breaks cleanly. That’s not fringe pessimism — it’s a reasonable read of the chart structure after BTC slipped below $74K. CryptoPotato’s technical breakdown echoed this, noting that buyers are struggling to reclaim $74,500 and that the liquidation heatmap shows concentrated positions on both sides — meaning any sharp move gets amplified.
Decrypt framed the macro pressure cleanly: Bitcoin fell below $74,000 as the inflation beat increased pressure on the Fed to act in December. That framing is correct but slightly incomplete. It’s not just the Fed’s next meeting — it’s the signal that the disinflation narrative that powered much of crypto’s 2026 rally may be more fragile than the market assumed.
CryptoPotato’s earlier piece on downside risks highlighted that BTC was already under pressure heading into the report — the CPI data wasn’t the cause of the weakness, it was the confirmation. That distinction matters for timing any re-entry.

The Inflation Trap: Why Crypto Isn’t the Hedge It Was Supposed to Be
There’s an uncomfortable irony embedded in this selloff. Bitcoin was supposed to be the inflation hedge — the digital gold that thrives when fiat purchasing power erodes. And yet here we are: hot CPI drops, and BTC sells off. This isn’t new, but it’s worth stating plainly every time it happens so we don’t pretend otherwise.
The reality is that in a rising-rate environment, Bitcoin behaves more like a risk asset than a store of value. Higher rates mean higher opportunity cost for holding non-yielding assets. They mean tighter liquidity conditions globally. They mean institutional allocators trim the riskier end of their portfolios first — and crypto, despite its maturation, still lives at that end. As Cointelegraph described the mood after the print, analysts called the data ‘discouraging’ — which is diplomatic for ‘this is going to hurt.’
Ethereum and Solana are feeling it proportionally harder, with ETH down 2.4% and SOL off 2.7% in the last 24 hours. That’s consistent with what you’d expect: when BTC slips on macro, altcoins bleed faster. No surprise there, but it’s a useful reminder that there’s no shelter in rotating to alts during a Fed-driven selloff.
If you’re actively trading through this volatility, it’s worth comparing fee structures across platforms. Some exchange referral programs offer meaningful discounts on trading fees during high-volume periods like this — worth checking before you’re executing size in a fast-moving market.
My Actual Take: Don’t Catch This Knife, But Know Where the Handle Is
I’ve watched Bitcoin get destroyed by hawkish Fed cycles before, and the pattern is consistent: the first leg down is macro-driven, the second is capitulation from leveraged longs who held too long, and the third — if it comes — is the spot sellers who finally give up. We may be in the first leg right now, possibly transitioning to the second.
The $73,000 level is the line in the sand. If it holds into the weekend with no dramatic catalyst, the range between $72K and $75K probably consolidates for a week or two while the market waits on December Fed positioning. If $73K breaks on volume — especially with another round of ETF outflows — I wouldn’t rule out a test of $69,000 to $70,000. That would represent genuine capitulation territory, and that’s where the trade starts to look interesting again, not here.
The bull case for year-end hasn’t disappeared. It’s just on pause while the inflation data forces a repricing of the rate path. If December’s CPI softens, this selloff will look like noise by January. But trying to front-run that recovery before the data confirms it is exactly how traders get caught offside. For now, the highest-probability move is patience — let the macro uncertainty clear, let the ETF flow picture stabilize, and look for a clean re-entry with defined risk rather than averaging into a falling knife. For ongoing market coverage as this develops, the crypto news hub is worth keeping open.
Popular Exchange Referral Codes
- Bybit Referral Code 2026: Get 20% Fee Discount for 90 Days with Code 19670
- Bitget Referral Code 2026: Get 20% Trading Fee Discount with Code t4685009
- OKX Referral Code 2026: Get 20% Trading Fee Discount with Code 64912533
- HTX Referral Code 2026: Get 20% Trading Fee Discount with iddq7223
- Gate.io Referral Code 2026: Get a 20% Trading Fee Discount with Code NZRAPCBW
